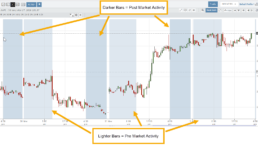
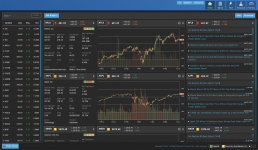
Intraday Charts displaying Pre/Post Market Activity
Intraday extended-hours charting enables users to visualize price movement beyond standard market hours, providing a more complete picture of how news, earnings, and overnight activity impact their setups. This helps reinforce timing, entries, and the real-world behavior of the markets.
Extended Trading Hours
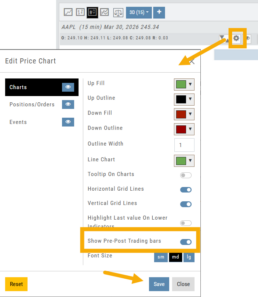
Pre and Post-Market activity can be displayed on Intra-Day charts:
First, click on the Gear icon as shown.
Then, toggle “Show Pre-Post Trading bars” to the On position, as shown.
Finally, “Save”.
26-03 Release Notes: Journal Auto-Reconcile, Extended Trading, New Charting Indicators
Platform Release Summary
This release helps you see more of the market, spend less time tracking trades, and apply your strategies with greater confidence—with extended-hours charting, automated journal reconciliation, and new technical indicators.
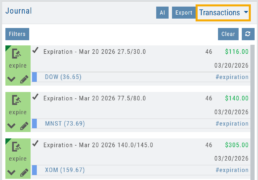
Journal Auto-Reconcile
The auto-reconciliation in the Trade Journal aligns trades and results—allowing users to focus on analyzing performance instead of managing data. Since consistent review is key to improving as a trader, this feature makes the process significantly easier and more accurate
Start in the Reconcile View of the Journal:
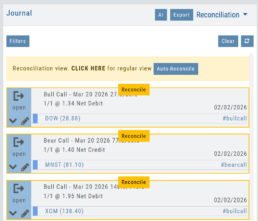
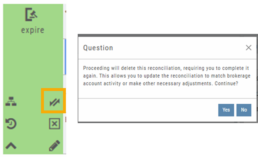
Next, click the ![]() button.
button.
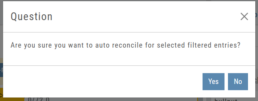
The dialog box to the left will appear:
Click “Yes”
The display will list the resulting action for each expiration.
You can scroll to review.
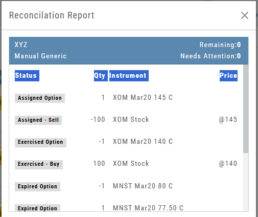
The Reconcile view will clear and all Journal Tabs will update to reflect the action resulting from each Expiration.
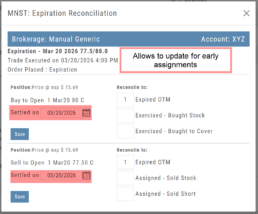
The arrow icon (shown) allows editing – including early assignment of options.
Note: This icon will *only* appear on Journal Tabs where the function is permitted.
Example: Stock Positions will not display the icon.
Extended Trading Hours
Pre and Post-Market activity can be displayed on Intra-Day charts:
First, click on the Gear icon as shown.
Then, toggle “Show Pre-Post Trading bars” to the On position, as shown.
Finally, “Save“.
Additions: New Charting Indicators
Chande Momentum Indicator (CMO)
Measures the strength of price movement by evaluating both gains and losses, providing a more balanced view than traditional oscillators.
- Above +50: Indicates overbought conditions (potential selling opportunity)
- Below -50: Indicates oversold conditions (potential buying opportunity)
Summary: Helps identify when price movement may be overextended and due for a reversal.
Chaikin Money Flow (CMF)
An oscillator measuring buying and selling pressure by analyzing money flow volume over a set period, rather than cumulatively.
- Positive values: Indicate buying pressure (accumulation)
- Negative values: Indicate selling pressure (distribution)
- Default setting: 20-period (typically 20 days)
Summary: Helps identify whether money is flowing into or out of a security over a defined timeframe.
Directional Movement Index (DMI)
A trend indicator that measures both the direction and strength of a trend using three lines: ADX, +DI, and -DI.
- +DI above -DI: Indicates an uptrend
- -DI above +DI: Indicates a downtrend
- ADX: Measures trend strength (regardless of direction)
- Default setting: 14-period
Summary: Helps identify trend direction and the trend’s strength
Ultimate Oscillator
A momentum indicator that combines three timeframes to provide a more balanced view of market strength and reduce false signals.
- Higher values: Indicate stronger buying pressure
- Lower values: Indicate stronger selling pressure
- Used to identify overbought/oversold conditions and potential trend reversals
Summary: Helps confirm momentum and spot potential turning points with greater reliability.
Change Log
- Improve OHLC appearance
- Repair drawing annotations on extended chart
- Reconciliation mode functionality fixed
Custom (Premium Desktop Feature)
Custom Page – Customize What You Want To See
Custom Page
You’ll find Custom under the Home tab (formerly Market tab). Trade Central gives you a one-stop view of your selected Stocks/ETFs. Add Quote Boxes, Multiple Charts and News for your selections and overall Market News.
Rearrange the content to fit your preferences, the platform will adjust to maximize the view according to the device you are using.
This is a flexible feature with a number of ways to structure the Custom page. The widgets are adjustable, allowing you to rearrange, add, substitute or remove as needed.
Read below to learn more and get started:
Add Widgets
Check the box for “Quote“, “Chart“, and/or “News” and enter quantity for each then click “Enter”.
Add the Symbol in the appropriate box for the data to populate.
Note: To remove a widget, click the ‘x’ in the upper right corner of the box.
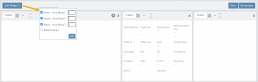
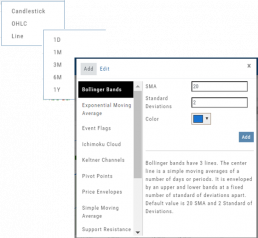
Chart Widget
After adding “Chart” widget and Stock/ETF symbol, click the Gear Icon (upper right corner of widget box) to select:
Time Period: 1 Day, 1 Month, 3 Month, 6 Month or 1 Year
Chart Types: Candlestick, OHLC or Line
Indicators: Over a dozen indicators available to add to each chart. You can edit and remove/change selected indicators on each chart.
Custom lets you add multiple chart set-ups per Symbol for a convenient way to research existing trades or find opportunities.
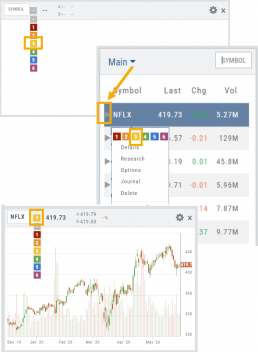
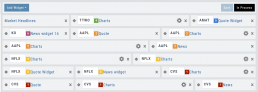
Widget Settings
Rather than enter a symbol on each Chart, Quote or News component, you can assign a number to each widget.
Then, using the Watchlist displayed on the left side of the screen, click the Action Icon (triangle) to left of Stock Symbol you want to display and assign a number, 1 thru 12
The widgets with that number will automatically populate accordingly.
To change displaying one symbol to another using a Watchlist, simply click on the Action Icon of new Symbol and select the number of the current Symbol you want to replace.
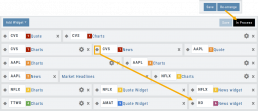
Adjust Custom Display
Adjust the order display by clicking on the Re-Arrange button on the Upper Right corner of Trade Central screen.
The display changes to placeholder bars for easy drag/drop action. Re-Arrange button changes to “In Process“.
Click on the Bulls-Eye icon to the left of the Stock/ETF symbol, then drag/drop to new location.
When completed, click on “Save“, then “In Process” to return to Trade Central main view.